

By Aman Foujdar, Sandeep Juneja, Atish Kumar, and Nagpurnanand Prabhala
Aug 06, 2026
Investors who pick individual stocks are betting that their research will find something the market has missed. Sometimes it does. But the record of the people best equipped to make that bet is sobering. Fund managers work with better data, better tools and more time than individual investors. Yet, over long horizons, most of them still fail to beat a simple index fund. As Jack Bogle of Vanguard famously quipped, “You get what you don’t pay for.” Or, as Warren Buffett predicted with a $1 million bet in 2008, an index decisively beat curated bets by sophisticated managers.
What we see is not necessarily a talent problem. Rather, prices move quickly to absorb public information, making it hard to attain consistent outperformance for individual stocks. This leads to an obvious question: if picking individual winners is hard to scale and repeat, do some groups of stocks earn more than others over time? And why? Factor investing addresses these questions.
Characteristics over companies
Stock picking starts with a company. Factor investing starts with firm characteristics. Is a stock cheap or expensive relative to its book value? Is the firm small or large? Is it generating high operating margins, or burning cash? Is it expanding its asset base aggressively, or carefully?
Traits such as these are called factors. A factor portfolio groups stocks with similar traits. Sorting stocks into portfolios averages away company-specific randomness, leaving a less idiosyncratic signal. In the U.S. market, Fama and French (1993) added size and value to the single market factor of the CAPM. Important factors added since then include momentum, profitability, and investment. Other candidates continue to emerge in what is called the “factor zoo.” For a fuller discussion, see Foujdar et al. (2026), hosted at The Safexpress Centre for Data, Learning, and Decision Sciences (SCDLDS) website factor library home. A factor portfolio tilts systematically towards the traits that have historically paid: it buys the stocks scoring highest on a trait and, where shorting is allowed, sells short those scoring lowest.
Why should we see factor premiums? Research offers three explanations. One is compensation for risk. For example, small firms are more fragile, more likely to fail in a credit crunch, so investors demand a higher expected return to hold them. Second, information is processed imperfectly. Markets may slowly absorb (or overreact to) news such as strong earnings growth with a lag that a rules-driven strategy can ride. Third, institutional constraints may prevent quick correction. For example, fund managers face benchmark pressure, short-selling restrictions and liquidity limits. A strategy that is attractive over the long run may suffer years of underperformance, and thus be abandoned before premium realization. Exploiting these opportunities is costly, so prices need not adjust fully or quickly and factor premiums persist.
What existed for India, and our contribution
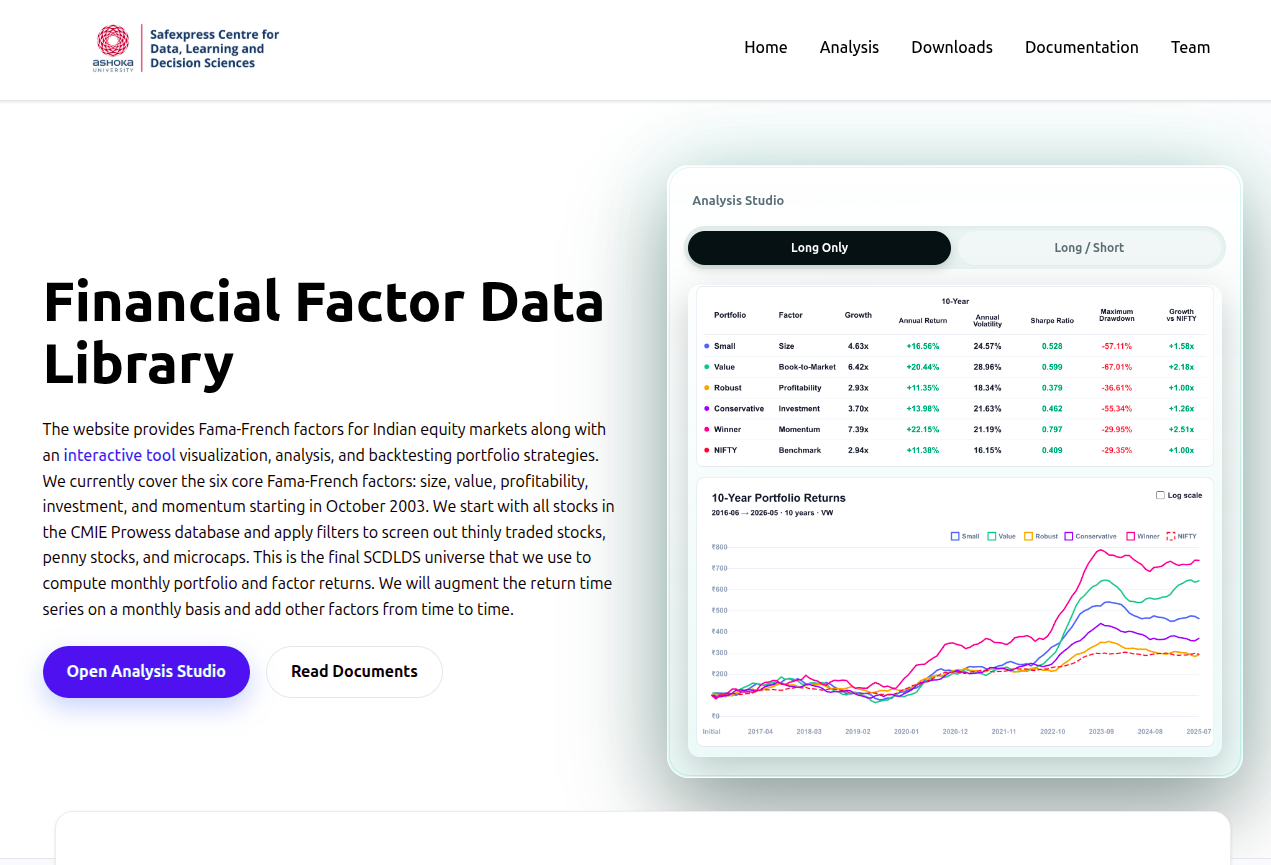
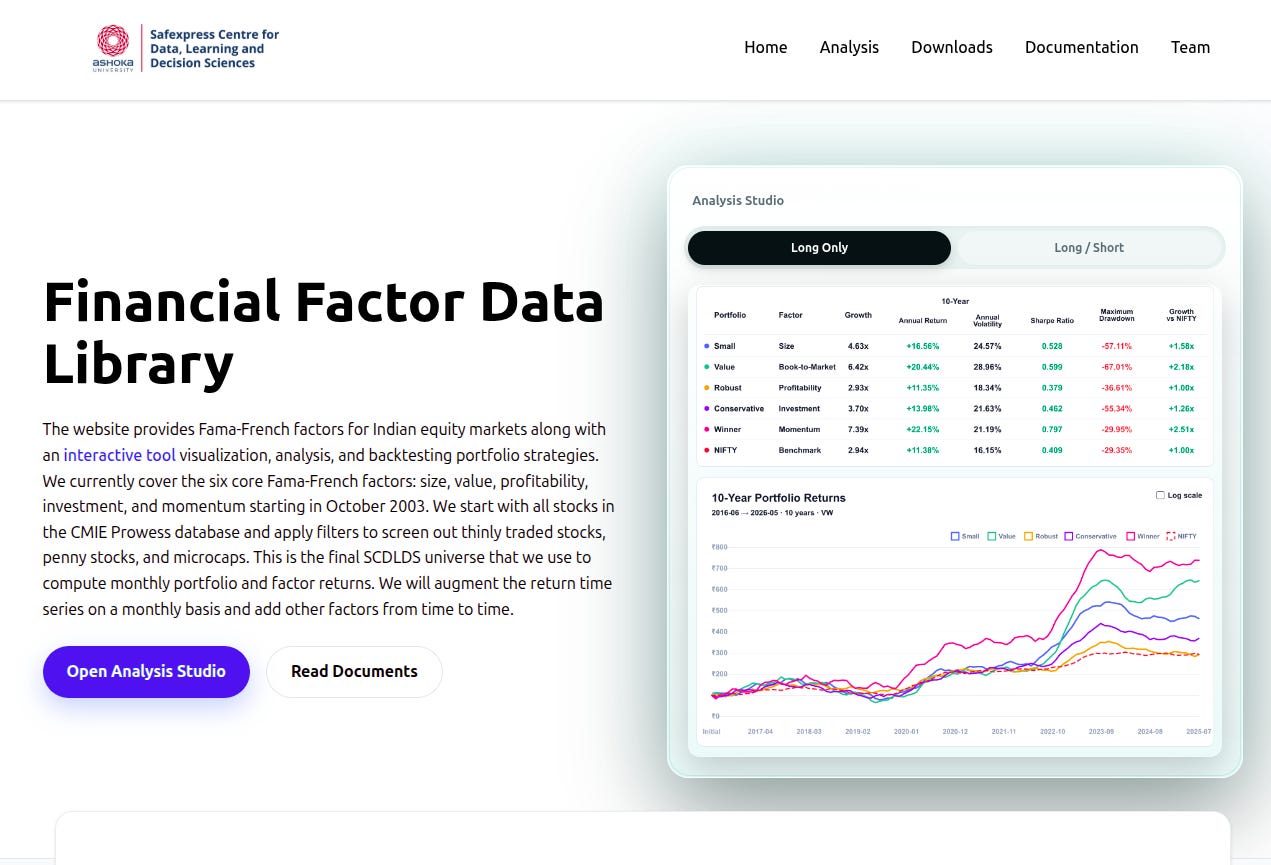
The SCDLDS group has built a factor library for Indian equities covering October 2003 to May 2026, drawn from CMIE Prowess Foujdar et al. (2026). It rests on one principle: returns should reflect tradability in the Indian market. This point matters because many names listed on the NSE and BSE are too illiquid to trade in meaningful quantities. Including them distorts estimated factor premiums. For the filters we use on price, market cap, trading, and where relevant, negative book value, see Foujdar et al. (2026).
That said, our library is accompanied by an interactive tool that gives users the flexibility to assess factors in the full filtered universe or subsets of the largest 300 or 500 stocks. The tool, available at SCDLDS Interactive Tool, is updated monthly. It lets users build their factor strategies and generates returns and metrics including drawdowns and Sharpe ratios across factor combinations and multiple horizons along with simple transaction cost adjustments to arrive at factor strategy premiums.
Existing factor libraries for India include Agarwalla et al. (2014) (AJV) and a part of the global effort of Jensen et al. (2023) (JKP). Our library fills gaps in both. AJV provides a subset of the factors, applies less stringent filters that retain more small stocks than we do, and we add an interactive computational and visualization tool for users. JKP construct 153 factors across 93 countries, India among them. Their choices of the universe do not adjust for India-specific market structure in the way ours do. The choices matter. For example, the long-short momentum strategy for the 20-year period starting from October 2003 gives around 10% per year in our (more tradable) universe versus 12.5–13.8% in AJV while the JKP universe delivers 0.5–2% per year. How factors are constructed matters. See Foujdar et al. (2026) for details.
Factor premiums for India
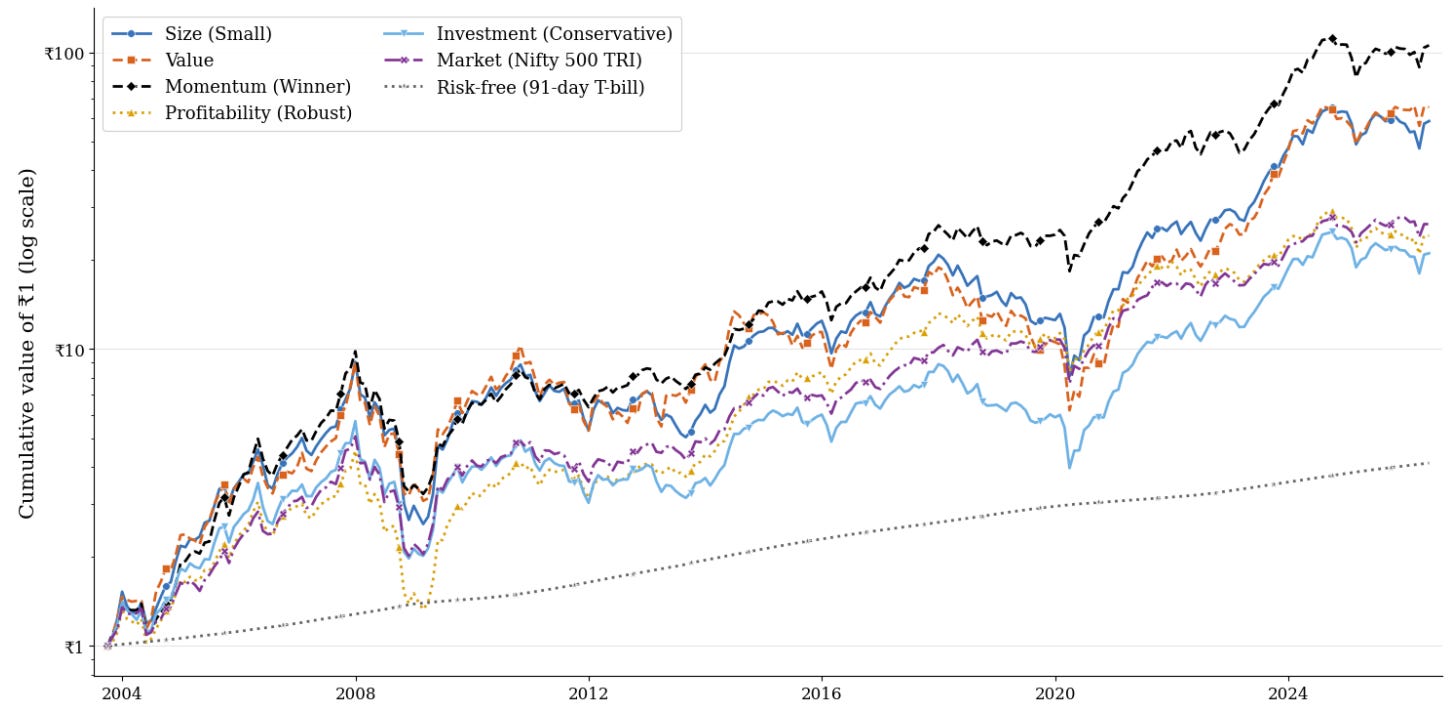
Over the full sample period from 2023 to 2026, the Nifty 500 total return index compounded at 15.52% per year, with a Sharpe ratio of 0.48. Momentum has a long-only portfolio compounded return of 22.82% per year and the highest risk-return tradeoff reflected in its Sharpe ratio of 0.70. Value and size give 20.25% and 19.68%, respectively. Operating profitability and investment yielding lower returns of 15.07% and 14.38% respectively.
Long-short factor returns are also instructive. The momentum long-short returns 10.81% a year from October 2023 to May 2026 with a Sharpe ratio of 0.61. Weight the five factors equally and the combined portfolio returns 6.09% a year, but the Sharpe ratio rises to 1.02, well above the 0.61 for momentum alone. The results show that factor premiums have low correlation, so diversifying across factors improves return-to-risk ratios. Multiple unrelated edges beat one perfect one.
Drawdowns, or the worst-case scenarios, matter for investors. The NIFTY-500 shows a peak-to-trough drawdown of 60% compared to between 66% and 72% for factor portfolios. The long–short versions had drawn-out slumps, from 20% for investment to 69% for value.
The above results are value-weighted backtest returns that exclude brokerage, market impact, fees and taxes. As might be expected – and as noted in prior U.S. research – high-turnover styles have greater transaction costs. Applying a 25 basis point transaction cost per side to the long-only momentum strategy which is rebalanced monthly cuts the compounded return from 22.82% to 21.06%. Better estimates of transaction costs are an ongoing research focus for the SCDLDS group.
What to do with any of this
For most investors, factor investing has three practical uses. First, it offers a transparent view of what actually drives mutual fund or ETF returns. A fund that markets itself on momentum may in fact be concentrated in small caps or load on factors the investor never signed up for. Factor analysis decomposes the risks a fund carries. The group views this application of factors as an interesting research direction.
Second, factors are a way to benchmark actively managed funds. A simple factor regression shows a fund’s systematic tilts and separates genuine skill from an unadvertised loading on small caps or momentum that can be bought far more cheaply elsewhere.
Third, an investor developing a strategy can use the tool to test factor blends, read off simulated Sharpe ratios and drawdowns, and see how individual stocks score on each measure.
Factor investing does not remove uncertainty. It replaces concentrated bets on individual stocks with diversified and explicit rules. Factor data make it possible to say with more precision what drove a return, what risk was taken to earn it, and whether the process can be repeated when the next market regime looks nothing like the last.
Performance metrics are historical, calculated using specific universe filters, and are not indicative of future results. This material is for educational purposes and does not constitute investment advice. For details and bibliography, please see Foujdar et al. (2026).
References
Sobhesh Kumar Agarwalla, Joshy Jacob, and Jayanth R. Varma. Four factor model in Indian equities market. Working Paper W.P. No. 2013-09, Indian Institute of Management Ahmedabad, 2014.
Eugene F. Fama and Kenneth R. French. Common risk factors in the returns on stocks and bonds. Journal of Financial Economics, 33(1):3–56, 1993.
Theis Ingerslev Jensen, Bryan Kelly, and Lasse Heje Pedersen. Is there a replication crisis in finance? The Journal of Finance, 78(5):2465–2518, 2023.